

Behind the Numbers
Behind each data point, there is a person, a researcher, or team, that is focused on making our world better.
FY2026
$923M+
in Research Grants and Sponsored Programs
Life Sciences 68%
Non-Science and Engineering Fields 15.7%
Engineering 8%
Geosciences, Atmospheric Sciences, and Ocean Sciences 2.4%
Social Sciences 2.3%
Physical Sciences 1.2%
Computer and Information Sciences 1%
Mathematics and Statistics 0.7%

Research and Innovation Sponsorship by Category
Federal $631.7M
State of New Jersey $126.3M
Corporate $107.3M
Foundations, Associations and Other $58.1M

$631.7M
in total Federal Sponsorships
National Institutes of Health (NIH) $321.8M
U.S. Department of Health and Human Services (DHHS) $138.2M
National Science Foundation (NSF) $56.3M
U.S. Department of Commerce $22.3M
Other $19.4M
U.S. Department of Defense (DOD) $19.1M
Department of Transportation $18.2M
U.S. Department of Agriculture (USDA) $13.9M
U.S. Department of Education $12.3M
U.S. Department of Energy (DOE) $10.2M


1,498
Rutgers Researchers
Received Awards in FY 2026

Active Innovations*
*Research and Sponsored Programs
674
Life Sciences
441
Physical Sciences and Engineering
999
Agriculture
237
Information Technology and Software
64
Content and Copyrighted Works
License and Option Agreements
90 (2022), 99 (2023), 127 (2024), 89 (2025), 135 (2026)

Active License,
Option Agreements by Category
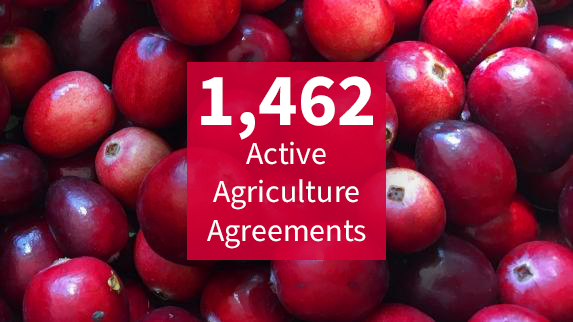
Agriculture 1,462 (88%), Life Sciences 110 (7%), Physical Sciences and Engineering 38 (2%), Information Technology and Software 30 (2%), Content and Copyrighted Works 27 (2%)

Did you know?
208
Industry Partners
146
Awards over $1M
235
Innovation Disclosures
Want to learn more about Rutgers?